GraphCSVAE: Graph Categorical Structured Variational Autoencoder for Spatiotemporal Auditing of Physical Vulnerability Towards Sustainable Post-Disaster Risk Reduction
作者: Joshua Dimasaka, Christian Geiß, Robert Muir-Wood, Emily So
分类: cs.LG
发布日期: 2025-09-12
备注: Accepted full paper at the 8th International Disaster and Risk Conference, IDRC 2025 | Keywords: weakly supervised, graph deep learning, categorical distribution, physical vulnerability, remote sensing, spatiotemporal disaster risk, transition matrix | The data and code are respectively available at https://doi.org/10.5281/zenodo.16656471 and https://github.com/riskaudit/GraphCSVAE
💡 一句话要点
提出GraphCSVAE模型,用于灾后物理脆弱性的时空审计与可持续风险降低。
🎯 匹配领域: 支柱八:物理动画 (Physics-based Animation)
关键词: 图神经网络 变分自编码器 时空数据 物理脆弱性 灾后风险评估
📋 核心要点
- 现有方法在模拟风险方程中同样重要但更具挑战性的要素——物理脆弱性方面进展有限。
- GraphCSVAE框架结合深度学习、图表示和分类概率推理,利用时序卫星数据和专家知识建模物理脆弱性。
- 该模型揭示了灾后区域物理脆弱性的动态变化,为灾后风险降低提供了时空审计和可持续策略。
📝 摘要(中文)
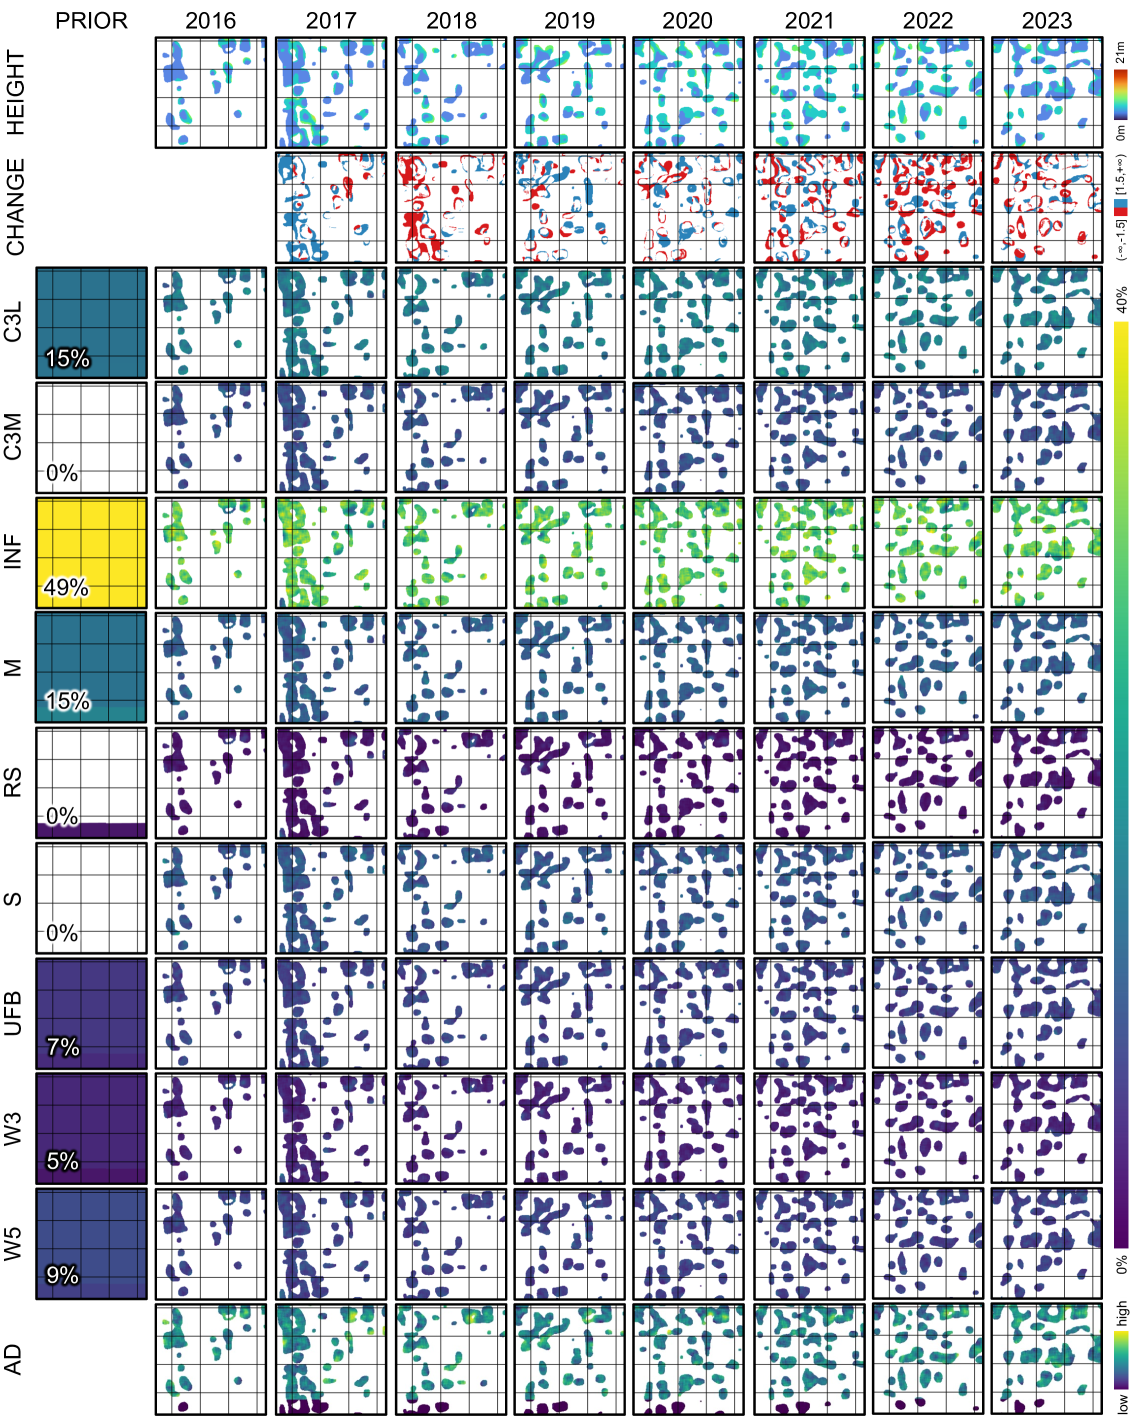
本文提出了一种新颖的概率数据驱动框架Graph Categorical Structured Variational Autoencoder (GraphCSVAE),用于模拟物理脆弱性。该框架集成了深度学习、图表示和分类概率推理,并利用时间序列卫星遥感数据和先验专家知识。通过引入弱监督的一阶转移矩阵,反映了孟加拉国受飓风影响的Khurushkul沿海社区和塞拉利昂受泥石流影响的弗里敦市这两个灾区物理脆弱性的时空分布变化。研究揭示了灾后物理脆弱性的区域动态,为局部时空审计和灾后风险降低的可持续策略提供了有价值的见解。
🔬 方法详解
问题定义:论文旨在解决灾后物理脆弱性难以持续监测的问题,现有方法难以有效整合时空数据和专家知识,从而限制了对灾害风险变化的评估和可持续风险降低策略的制定。
核心思路:论文的核心思路是利用图结构来表示地理空间关系,并结合变分自编码器(VAE)进行概率建模,从而捕捉物理脆弱性的时空动态变化。通过引入分类变量和结构化推理,模型能够更好地表示脆弱性的不同状态和转移模式。
技术框架:GraphCSVAE框架主要包含以下几个模块:1) 图构建模块,用于将地理空间区域表示为图结构,节点代表区域,边代表区域之间的邻接关系;2) 编码器模块,利用图神经网络(GNN)将输入的时序卫星数据和专家知识编码为潜在空间中的表示;3) 分类变量模块,用于将潜在表示映射到离散的脆弱性类别;4) 解码器模块,用于从潜在空间重构输入的时序数据;5) 弱监督模块,利用一阶转移矩阵来约束脆弱性类别之间的转移概率。
关键创新:该论文的关键创新在于:1) 提出了GraphCSVAE框架,将图表示、深度学习和分类概率推理相结合,用于建模物理脆弱性;2) 引入了弱监督的一阶转移矩阵,利用专家知识来约束模型的学习过程,提高了模型的准确性和可解释性;3) 将该框架应用于实际的灾后风险评估,验证了其有效性和实用性。
关键设计:在网络结构方面,编码器和解码器可以采用不同的GNN结构,例如图卷积网络(GCN)或图注意力网络(GAT)。损失函数包括重构损失、KL散度损失和弱监督损失。重构损失用于衡量重构数据的质量,KL散度损失用于约束潜在空间的分布,弱监督损失用于约束脆弱性类别之间的转移概率。一阶转移矩阵的构建依赖于领域专家的知识和经验,需要仔细设计。
🖼️ 关键图片


📊 实验亮点
该研究在孟加拉国和塞拉利昂的两个灾区进行了实验,结果表明GraphCSVAE能够有效地捕捉物理脆弱性的时空动态变化,并为灾后风险评估提供有价值的见解。通过与基线方法进行比较,GraphCSVAE在脆弱性预测的准确性和可解释性方面均取得了显著提升。(具体性能数据未知)
🎯 应用场景
该研究成果可应用于灾后风险评估、城市规划、基础设施建设等领域。通过对物理脆弱性进行时空审计,可以帮助决策者更好地了解灾害风险的变化趋势,制定更有效的风险降低策略,提高社区的抗灾能力,并为可持续发展提供支持。
📄 摘要(原文)
In the aftermath of disasters, many institutions worldwide face challenges in continually monitoring changes in disaster risk, limiting the ability of key decision-makers to assess progress towards the UN Sendai Framework for Disaster Risk Reduction 2015-2030. While numerous efforts have substantially advanced the large-scale modeling of hazard and exposure through Earth observation and data-driven methods, progress remains limited in modeling another equally important yet challenging element of the risk equation: physical vulnerability. To address this gap, we introduce Graph Categorical Structured Variational Autoencoder (GraphCSVAE), a novel probabilistic data-driven framework for modeling physical vulnerability by integrating deep learning, graph representation, and categorical probabilistic inference, using time-series satellite-derived datasets and prior expert belief systems. We introduce a weakly supervised first-order transition matrix that reflects the changes in the spatiotemporal distribution of physical vulnerability in two disaster-stricken and socioeconomically disadvantaged areas: (1) the cyclone-impacted coastal Khurushkul community in Bangladesh and (2) the mudslide-affected city of Freetown in Sierra Leone. Our work reveals post-disaster regional dynamics in physical vulnerability, offering valuable insights into localized spatiotemporal auditing and sustainable strategies for post-disaster risk reduction.