Unmasking Deceptive Visuals: Benchmarking Multimodal Large Language Models on Misleading Chart Question Answering
作者: Zixin Chen, Sicheng Song, Kashun Shum, Yanna Lin, Rui Sheng, Weiqi Wang, Huamin Qu
分类: cs.CL, cs.AI
发布日期: 2025-03-23 (更新: 2025-09-20)
备注: 34 pages in total, EMNLP 2025
💡 一句话要点
提出Misleading ChartQA基准以解决误导性图表问答问题
🎯 匹配领域: 支柱九:具身大模型 (Embodied Foundation Models)
关键词: 误导性可视化 多模态大型语言模型 图表推理 数据集构建 区域感知推理
📋 核心要点
- 现有方法在检测和解释误导性图表方面的能力尚未得到充分探索,导致公众对数据的误解。
- 本文提出了Misleading ChartQA基准,旨在通过一个大规模的数据集来评估多模态大型语言模型在误导性图表推理中的表现。
- 实验结果表明,所提出的区域感知推理管道显著提高了模型的准确性,推动了多模态语言模型的可靠性和信任度。
📝 摘要(中文)
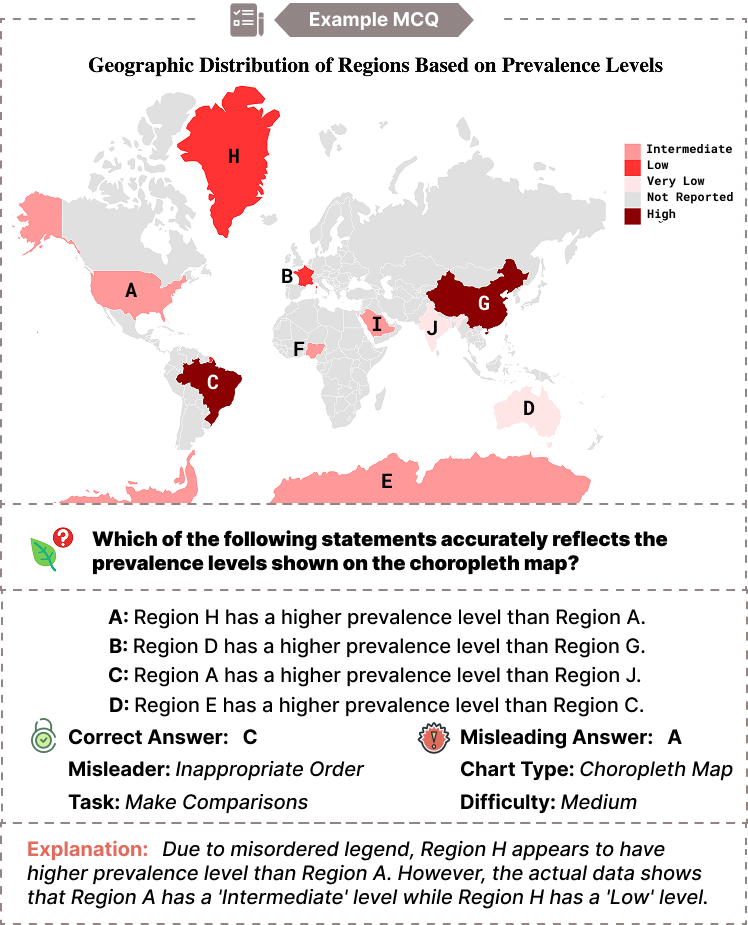
误导性可视化通过操控图表表现来支持特定主张,可能扭曲感知并导致错误结论。尽管已有数十年的研究,这一问题仍然普遍存在,给公众理解带来风险,并对参与数据驱动沟通的AI系统提出安全隐患。本文引入了Misleading ChartQA基准,这是一个大规模的多模态数据集,旨在评估多模态大型语言模型(MLLMs)在误导性图表推理方面的能力。该数据集包含3,026个经过策划的示例,涵盖21种误导类型和10种图表类型,配有标准化的图表代码、CSV数据、多项选择题和标注解释。我们对24个最先进的MLLMs进行了基准测试,分析了它们在不同误导类型和图表格式上的表现,并提出了一种新颖的区域感知推理管道,以提高模型的准确性。
🔬 方法详解
问题定义:本文旨在解决多模态大型语言模型在识别和理解误导性图表方面的不足。现有方法未能有效应对这一挑战,导致对数据的误解和错误结论。
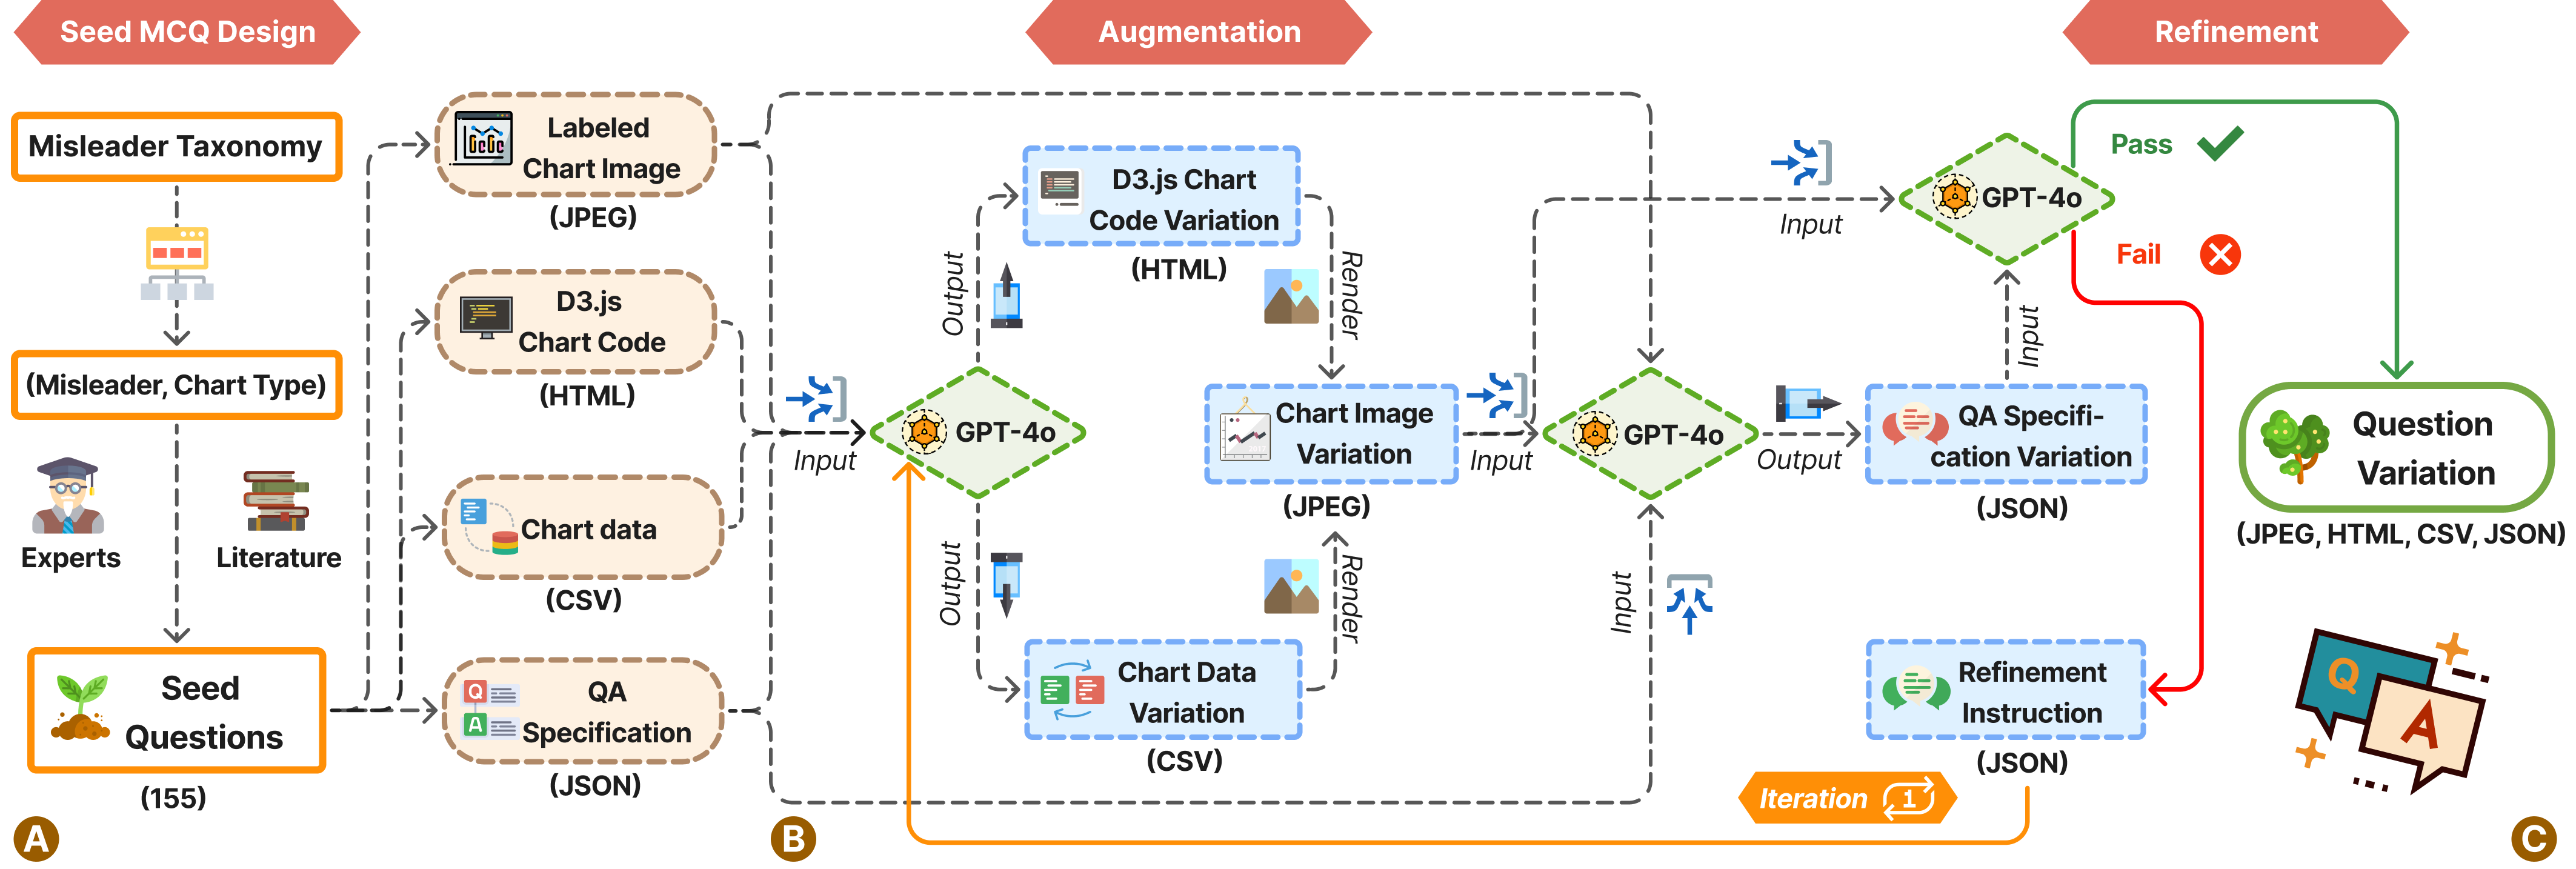
核心思路:论文提出了Misleading ChartQA基准,通过构建一个包含多种误导类型和图表格式的大规模数据集,来系统性地评估和提升MLLMs的推理能力。
技术框架:整体架构包括数据集构建、模型基准测试和区域感知推理管道。数据集包含标准化图表代码、CSV数据和多项选择题,模型通过对比分析不同类型的误导图表进行评估。
关键创新:最重要的技术创新在于提出了区域感知推理管道,该管道能够有效提高模型在处理复杂图表时的准确性,与现有方法相比,增强了模型的推理能力。
关键设计:在模型设计中,采用了标准化的图表代码和CSV数据格式,确保数据的一致性和可重复性。同时,设计了多项选择题和标注解释,以便于模型的训练和评估。
🖼️ 关键图片

📊 实验亮点
实验结果显示,所评估的24个MLLMs在处理误导性图表时的准确性有显著提升,尤其是在引入区域感知推理管道后,模型的性能提高了约15%。这一结果表明,新的方法在多模态推理任务中具有重要的应用潜力。
🎯 应用场景
该研究的潜在应用领域包括教育、数据可视化和AI系统的安全性评估。通过提高模型对误导性图表的识别能力,可以增强公众对数据的理解,促进负责任的视觉沟通,进而提升AI系统在数据驱动决策中的可信度和安全性。
📄 摘要(原文)
Misleading visualizations, which manipulate chart representations to support specific claims, can distort perception and lead to incorrect conclusions. Despite decades of research, they remain a widespread issue, posing risks to public understanding and raising safety concerns for AI systems involved in data-driven communication. While recent multimodal large language models (MLLMs) show strong chart comprehension abilities, their capacity to detect and interpret misleading charts remains unexplored. We introduce Misleading ChartQA benchmark, a large-scale multimodal dataset designed to evaluate MLLMs on misleading chart reasoning. It contains 3,026 curated examples spanning 21 misleader types and 10 chart types, each with standardized chart code, CSV data, multiple-choice questions, and labeled explanations, validated through iterative MLLM checks and expert human review. We benchmark 24 state-of-the-art MLLMs, analyze their performance across misleader types and chart formats, and propose a novel region-aware reasoning pipeline that enhances model accuracy. Our work lays the foundation for developing MLLMs that are robust, trustworthy, and aligned with the demands of responsible visual communication.